Templates: The Key to improved Productivity
-1741548812.png)
In organizations, business intelligence teams play a crucial role in providing strategic information to guide decisions. However, the way this information is presented can make the difference between informed decision-making and widespread confusion. This is where dashboard or report templates come into play. This article explores the key benefits of using standardized templates in a business intelligence context.
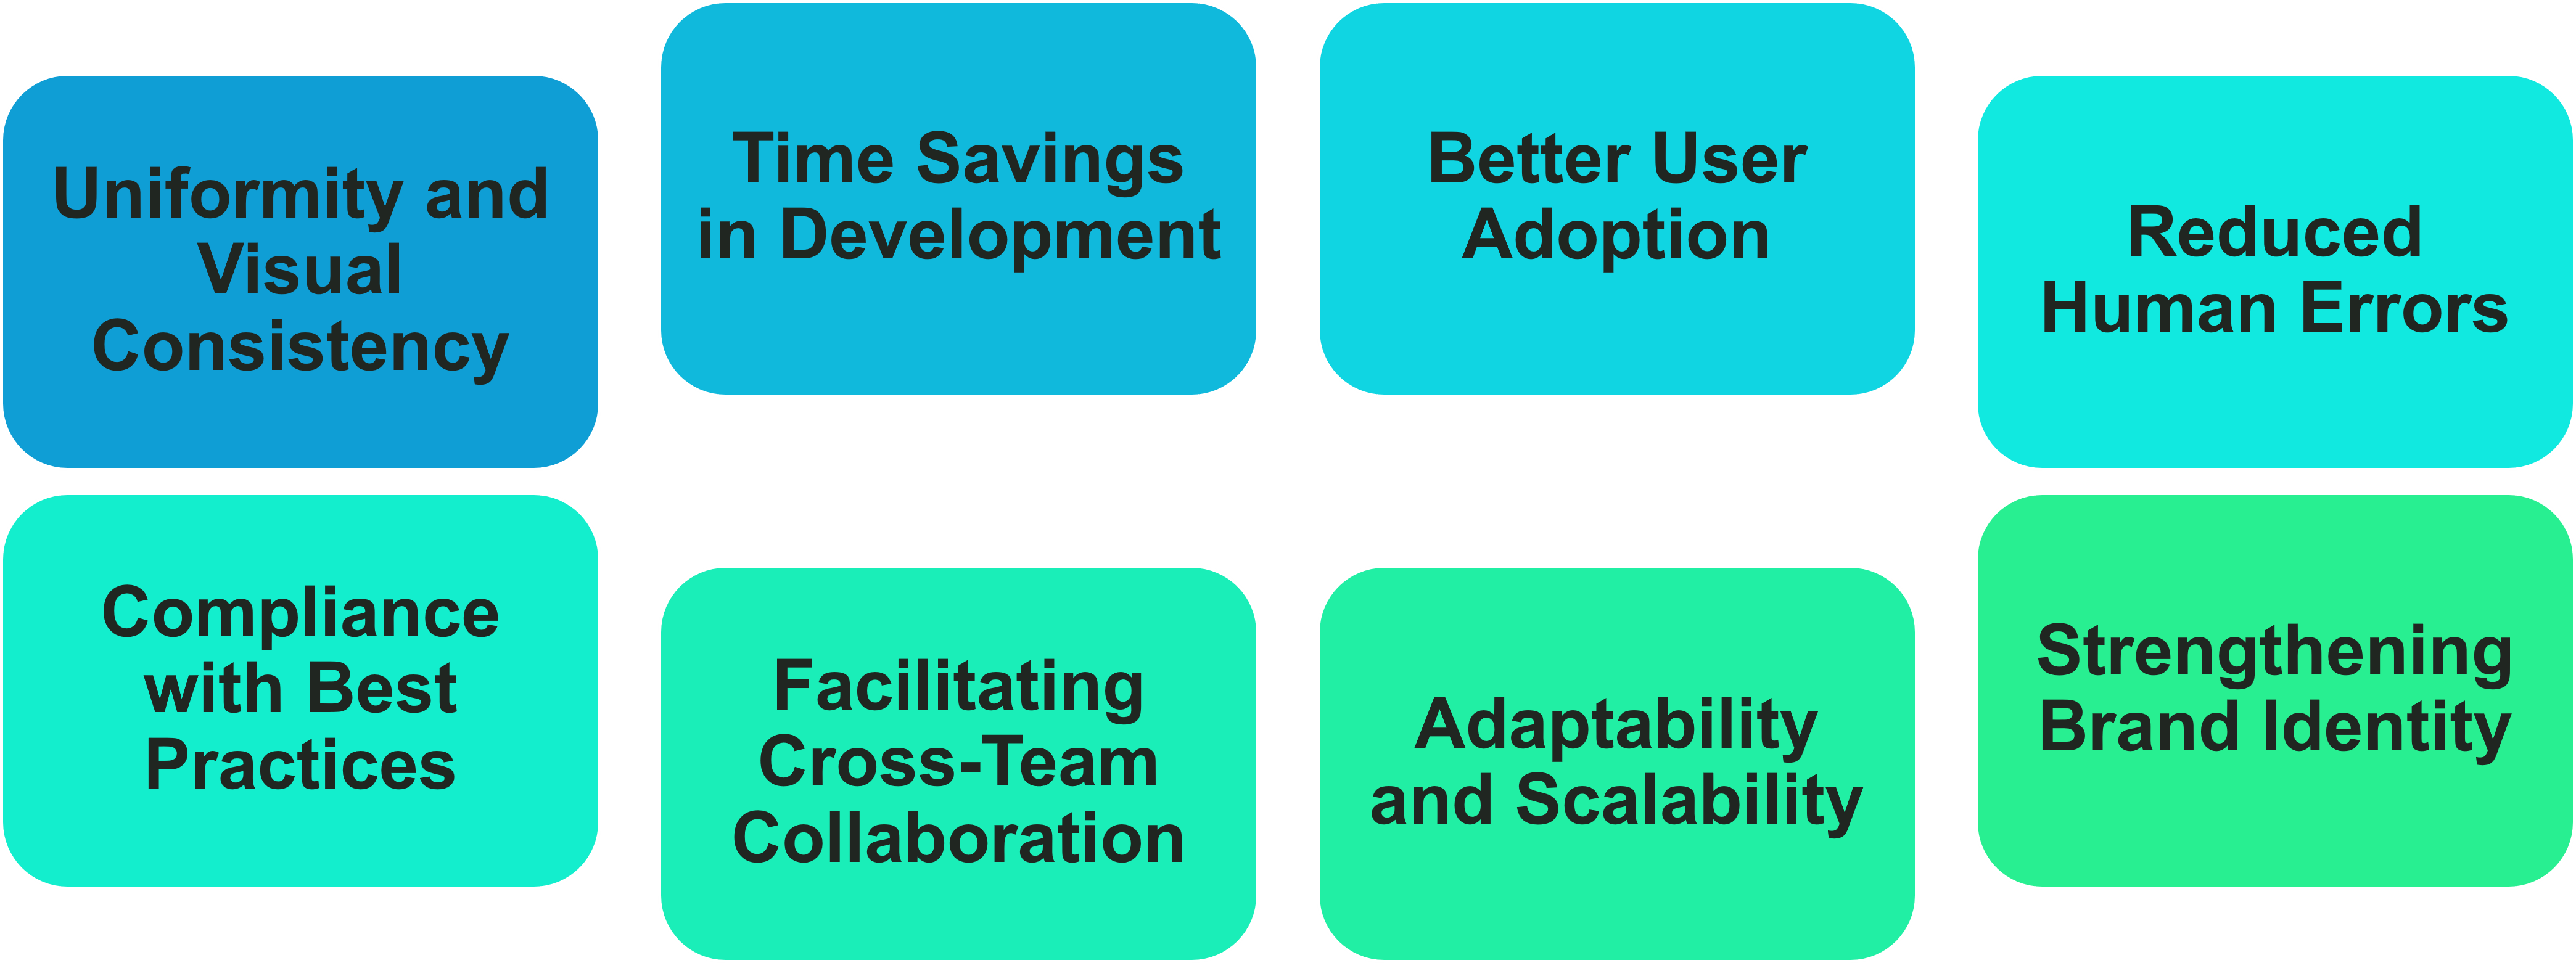
1. Uniformity and Visual Consistency
In a large organization, end users of dashboards and reports often come from various departments, such as human resources, sales, or customer service. Using a template ensures that each report or dashboard follows a uniform visual structure.
Benefits for users: Employees quickly become familiar with a standardized layout, making navigation between different reports easier. Think of it like a website—you become so used to using the same site that you no longer need to look at the navigation bar. The same principle applies to informational products.
For the team’s image: A consistent presentation enhances the credibility of the business intelligence team and conveys a professional image. When all elements of a product look visually similar, it creates a sense of cohesion and reliability.
2. Time Savings in Development
Creating dashboards or reports from scratch can be time-consuming, especially when ensuring that all elements comply with best practices in data visualization.
Standardization of elements: A template often includes predefined elements, such as colors that align with the brand’s style guide, fonts, and designated spaces for titles and legends. The logo is also always in the same place, and it is recommended to insert the data update date in a fixed location to facilitate navigation.
Less trial and error: Developers can focus on content (data and analysis) rather than design. This allows for the production of more informational products that lead to better decision-making.
3. Better User Adoption
In a business intelligence context, the value of a dashboard or report depends on its adoption by end users. A well-designed template enhances this adoption.
Intuitive navigation: Templates are often designed to guide users through a logical hierarchy of information.
Reduced learning curve: End users don’t need to "relearn" how to read each new informational product because they know what to expect.
4. Reduced Human Errors
Manually created reports can easily contain errors, whether in layout inconsistencies or missing critical data. A template minimizes these risks.
Built-in validation: Some templates may include features that automatically check for errors or anomalies.
Standardization of calculations: Ensuring that formulas and methodologies are uniform prevents varying interpretations of data. A date table can also be included in a template (more often found in the semantic model template), allowing the same company-wide holidays and week start dates to be used consistently.
5. Compliance with Best Visualization Practices
Templates designed by business intelligence experts often incorporate best practices to make data clear and engaging.
Focus on essentials: Templates encourage the removal of unnecessary or distracting elements, such as overly complex charts or excessive colors.
Accessibility: Inclusive design options can be integrated, such as color palettes adapted for colorblind users.
6. Facilitating Cross-Team Collaboration
In a large organization, dashboards and reports are often used by multidisciplinary teams. Using a template promotes collaboration.
Common language: When everyone works from the same model, it is easier to communicate needs and modifications. This even enables cross-team support during staff shortages, as team members can easily navigate a shared template.
Simplified sharing: Templates help standardize exports, making them easily integrable into presentations or written reports.
7. Adaptability and Scalability
A well-designed template can evolve with the organization’s needs. For example:
Easy additions or modifications: Modular templates allow new sections to be added without affecting the overall design.
Scalability: As the organization adopts new technologies or standards, templates can be updated to reflect these changes. If a company changes its colors and fonts to align with a new brand identity, it will be easier to adjust the original template and replace it in existing informational products.
8. Strengthening Brand Identity
In an organization, business intelligence often serves as the data showcase for internal and external stakeholders. A template aligned with the corporate style guide enhances brand recognition and identity.
Consistency with branding: Using company colors, logos, and fonts shows that the BI team is well-integrated into the organization.
Professional communication: Reports intended for external stakeholders, such as partners or regulators, project a positive image of the organization.
Conclusion
In an organization, using templates for dashboards and reports is a powerful lever for improving efficiency, collaboration, and decision-making. By ensuring visual uniformity, reducing errors, and fostering greater user adoption, templates are not just a design tool—they are a strategic pillar of business intelligence.
Adopting a standardized approach through templates means choosing to maximize the impact of your data. So, why hesitate? Make your dashboards and reports essential assets for your organization!